
24 March, 2023
From Struggling to Success: How Our Strategies Took Digital Marketer Evelyn to $100k Monthly Recurring Revenue
Let’s Talk About. . . Facebook’s Ad Relevance Diagnostics
The Facebook ad platform is constantly evolving. No surprise right?
Since pretty much everything online changes at lightning speed these days. But with new platform changes, it means your metrics will inevitably change too.
So here’s what you need to know. Last year, Facebook replaced the relevance score with three new metrics:
- Quality Ranking: How your ad’s perceived quality compares with ads competing for the same audience.
- Engagement Rate Ranking: How your ad’s expected engagement rate compares with ads competing for the same audience.
- Conversion Rate Ranking: How your ad’s expected conversion rate compares with ads with the same optimization goal (while still competing for the same audience).
According to the almighty Facebook, ad relevance diagnostics help advertisers figure out if changes to creative assets, audience targeting, or the post-click experience will improve performance. And similar to the relevance score, these ad relevance diagnostics are not factored into an ad’s performance in the auction.
Why does ad relevance diagnostics matter?
Because Facebook cares about its users and wants to show relevant ads (that’s what they’re saying at least!)
So for this reason, they use ad auctions to determine the best ad to show to someone at any given time.
Here’s the winning formula that Facebook uses to decide which ad wins the auction:
[Advertiser Bid] x [Estimated Action Rates] + [User Value] = Total Value
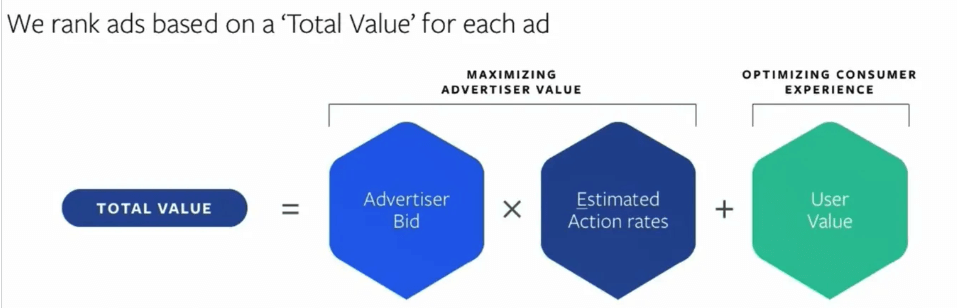
The user value is taken into account too for the relevance and ad quality. And the more relevant your ad is to your audience, the higher the chances of it performing better and being competitive in the auction (win-win, right?)
And to make sure the winning ad maximizes value for both people and businesses, the auction winner is the ad with the highest total value.
That’s why Facebook looks at how relevant an ad is to someone before delivering the actual ad.
So of course, the most relevant ads (with higher estimated action rates and ad quality) often cost less and see more results. In other words, a highly relevant ad may win an auction even against the ads with higher bids.
Because of this, Facebook suggests using ad relevance diagnostics to determine whether the ads you ran were relevant to the audience you reached.
Powerful information when you know what to do with it.
But if any of this sounds dizzying, we’re going to dive deeper.
Here’s how to use ad relevance diagnostics:
Facebook has recommendations aimed at helping you detect issues and improve your ads.
| Ad Relevance Diagnostics | Causes | Recommendations | ||
|---|---|---|---|---|
| Quality Ranking | Engagement Rate Ranking | Conversion Rate Ranking | ||
| Average or above | Average or above | Average or above | You’re all good! | Optimize for your advertising objective. |
| Below Average | — | — | The ad is perceived as low quality. | Improve the quality of your creative assets or target an audience more likely to perceive the ad as high quality. Avoid low-quality attributes from your creative. |
| Average or above | Average or above | Below Average | The ad isn’t producing conversions. | Improve the call-to-action of your ad or post-click experience, or target a higher-intent audience. Some products and services naturally exhibit lower conversion rates than others. If your conversions meet your expectations you may not need to adjust your ad. |
| Average or above | Below Average | Average or above | This ad isn’t spurring interest. | Improve your ad’s relevance to your audience (For example, by making it more engaging, interesting or eye-catching) or target an audience more likely to interact with this ad. |
| Below Average | Average or above | Average or above | The ad is perceived as low quality. | Improve the quality of your creative assets or target an audience more likely to perceive the ad as high quality. Avoid low-quality attributes from your creative. |
| Average or above | Below Average | Below Average | The ad isn’t spurring interest or producing conversions. | Improve both the ad’s relevance to your audience (For example, by making it more eye-engaging, interesting or eye-catching) and the call-to-action of your ad or post-click experience. Alternatively, target an audience more likely to interact with and convert from your ad. |
| Below Average | Below Average | Average or above | This ad is perceived as low quality and isn’t spurring interest. | Improve the quality of your creative assets while also making it more relevant to your audience (For example, by making it more engaging, interesting or eye-catching). Alternatively, target an audience more likely to perceive the ad as high quality and relevant. Avoid low-quality attributes from your creative. |
| Below Average | Average or above | Below Average | This ad is click-baity or controversial. | Adjust your ad to more clearly represent the product or service you are advertising. Some products and services naturally exhibit lower conversion rates than others. Avoid low-quality attributes from your creative. |
| Below Average | Below Average | Below Average | There’s room for improvement across the board. | Try testing different targeting strategies, creative, optimization goals, post-click experiences, and so on. |
So when your ads aren’t meeting your advertising goals, you can use ad relevance diagnostics to review the three spheres of relevance (quality, engagement, and conversion) to understand what’s really going on and what needs adjusting.
Plus, reviewing the diagnostics all together reveals better insights compared to looking at them individually.
But if an ad is already meeting your goals, then you can save time and skip reviewing ad relevance diagnostics if you want to.
Because sometimes, high-performing ads have below-average rankings—and that’s OK! Optimize for your advertising objectives (not for quality ranking, engagement rate, or conversion rate ranking).
Now, let’s look at how relevant metrics are correlated with ad performance (conversions).
Facebook says that high relevance is correlated with high performance, but is it true?
Are the relevance metrics correlated with ad performance (conversions)?
Is it always the main reason for getting high relevance ads? Or can we abandon those metrics when optimizing and scaling Facebook ads.
To understand it better, we did a correlation test between new relevance metrics and conversions.
Here’s what we found out from the test:
We analyzed three ad accounts (two e-commerce businesses and a service business).
For analysis, we took conversion campaigns and over 550 of their ads that contain data about ad relevance diagnostics. Not an easy task of course, but part of the process.
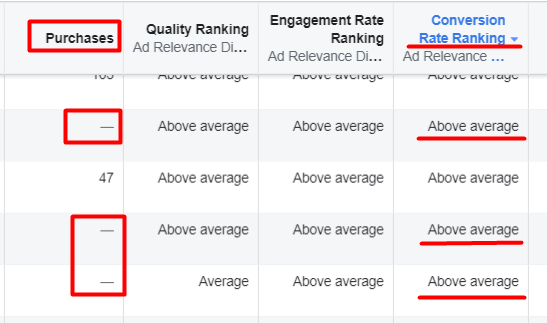
However, ad relevance diagnostics weren’t available even for ads with more than 500 impressions (Facebook states that these metrics aren’t available for ads with fewer than 500 impressions).
Note: There are tons of variables we didn’t take into account like seasonality, the funnel stage, changes in post-click experience so we can’t claim to be 100% accurate, but here’s what we discovered.
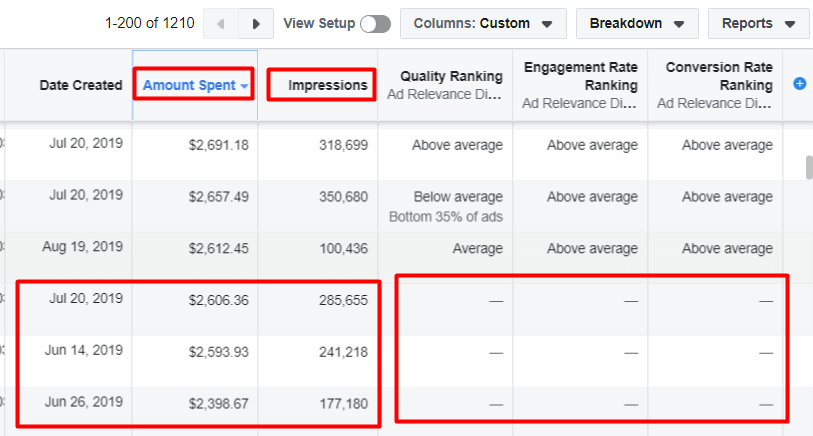
The screenshot above shows how ads with greater ad spend, and a greater number of impressions, don’t have data on ad relevance diagnostics.
Before jumping to the results, let’s get familiar with a few terms we’re going to use to help explore this further:
- Correlation is the measure of the linear relationship between two quantitative variables. Correlations are usually shown in a square table known as a correlation matrix. We used statistical software SPSS to create correlations and to get Pearson correlation coefficient.
- Pearson correlation coefficient is a number between -1 and 1 that shows the strength of the relationship between two variables. The larger the absolute value of the coefficient, the stronger the relationship between the variables. A correlation close to 0 indicates no linear relationship between the variables (aka there is no statistically relationship between the variables).
- Sig (2-Tailed) value is the two-tailed p-value. This value will tell you if there is a statistically significant correlation between your two variables. (If this is starting to sound like gibberish, you can read this to find out more about how to interpret data in SPSS for Pearson’s correlation and scatterplots).
Next up, we downloaded raw data from the Ad Manager to look at the correlation analysis and compare variables.
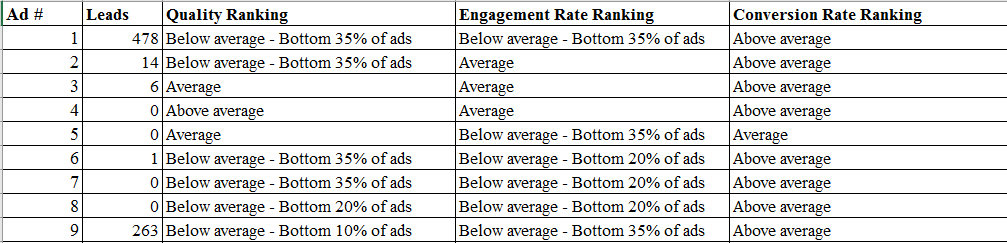
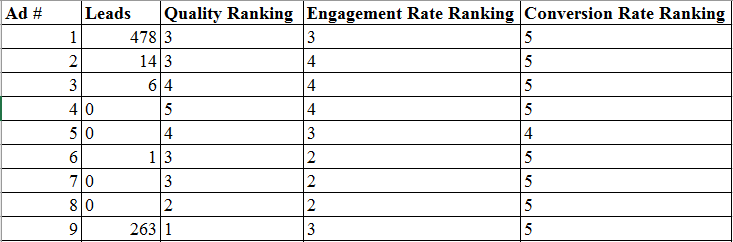
Then we translated ad relevance diagnostic metrics to these values:
- Above average to “5”
- Average (represents the 35th to 55th percentile) to “4”
- Below average (bottom 35% of ads) to “3”
- Below average (bottom 20% of ads) to “2”
- Below average (bottom 10% of ads) to “1”
And gathered the following data:
Let’s take a closer look at Case #1: Med Spa in Las Vegas.
We have 162 ads with ad relevance diagnostic metrics. All of these ads generated 7,280 leads in total.
By using the statistical software SPSS, we got the following results:
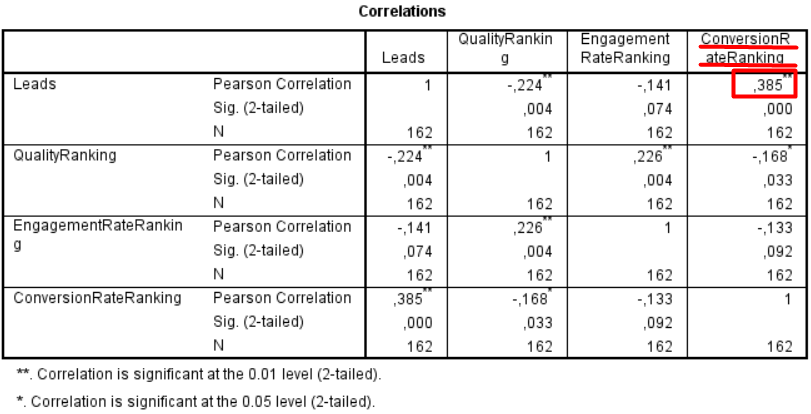
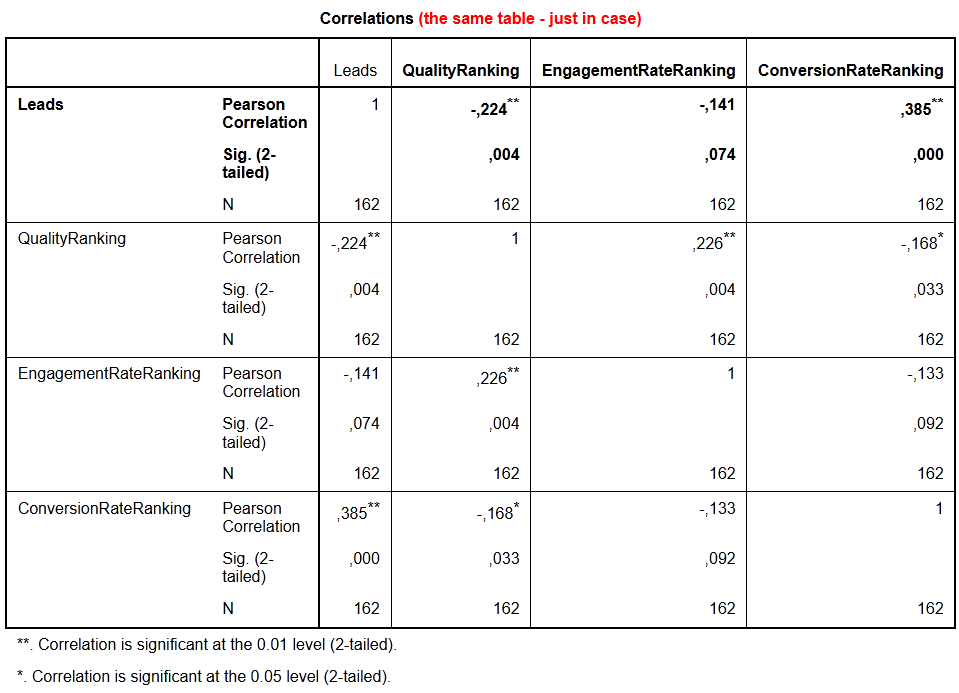
Here’s how to interpret this data:
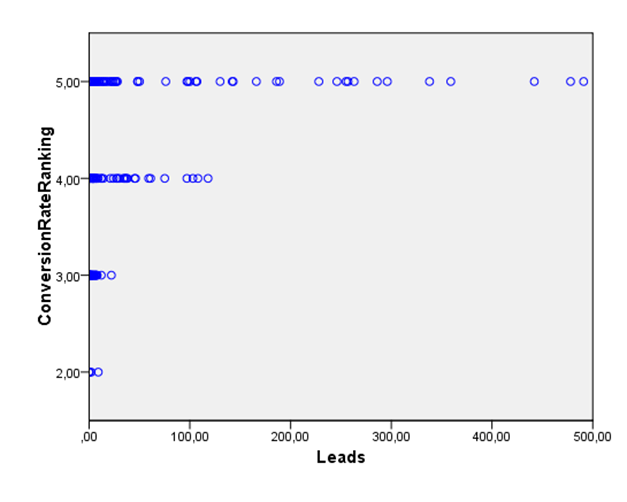
- There’s a positive correlation with a medium relationship (0.385) between Leads and Conversion Rate Ranking. The correlation is statistically significant since Sig. (2-tailed) is 0.000 which is less than .05.
- We determined that when the Conversion Rate Ranking increases (our first variable), the number of leads (our second variable) also increases.
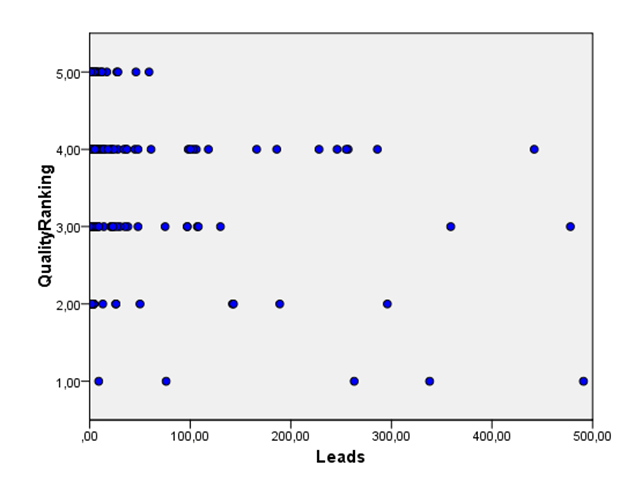
- There’s a negative correlation with a small relationship (-0.224) between Leads and Quality Ranking. The correlation is statistically significant as Sig. (2-tailed) is 0.004 < .05.
- We determined that when the Quality Ranking increases (our first variable), the number of leads (our second variable) decreases.
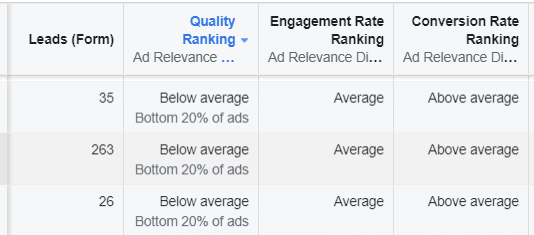
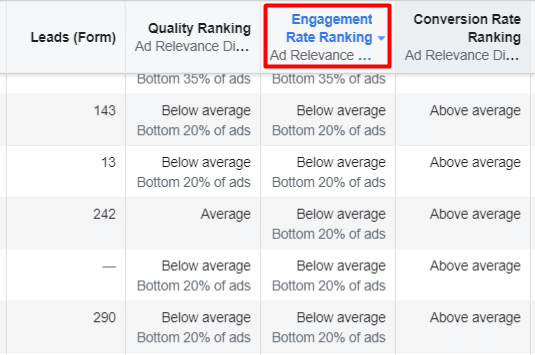
This conclusion seems a bit out of the blue, so we wouldn’t take this into consideration. But at the same time, the data isn’t skewed. We managed to get quite a few leads from ads with a low Quality Ranking (see the example below).
The reason for the low quality of ads might be from:
- Targeting: Since it’s a local business, we didn’t use laser targeting because it generated leads with expensive CPL. We also used a broad audience that actually worked (even though many people who saw our ads were not from our audience).
- Creative assets: We used stock images in the beginning.
And back to the data:
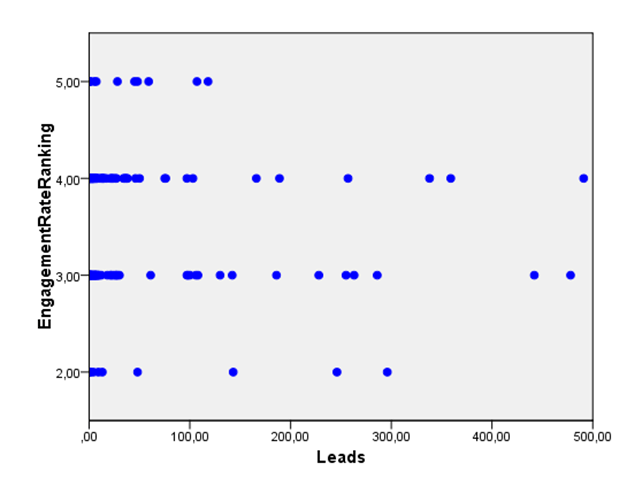
- There’s a negative correlation with a small relationship (-0.141) between Leads and Engagement Rate Ranking. The correlation is not statistically significant as Sig. (2-tailed) is 0.074 > .05.
- We determined that when the Engagement Rate Ranking increases, the number of leads decreases. Again, we wouldn’t take this into consideration. But for this ad account, we saw many leads from ads with a low Engagement Rate Ranking.
Now let’s look at Case #2 – E-commerce (toys).
We have 248 ads with ad relevance diagnostics metrics. All of these ads generated 12,914 purchases in total.
Here are the following results:
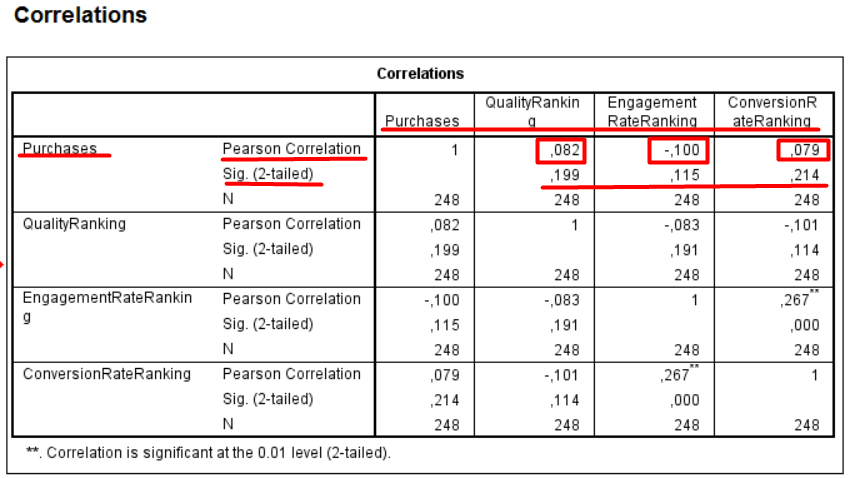
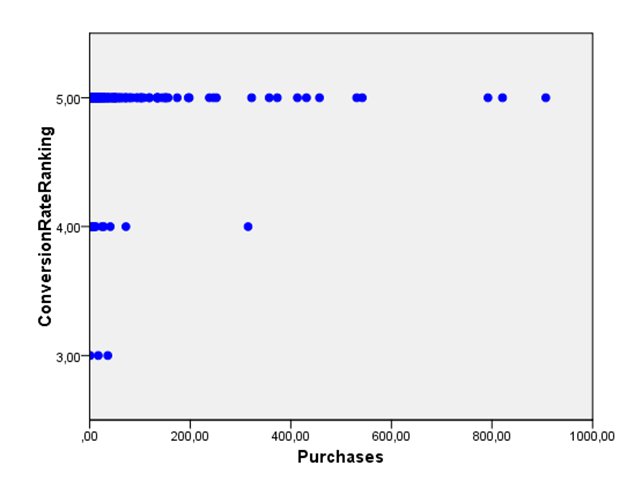
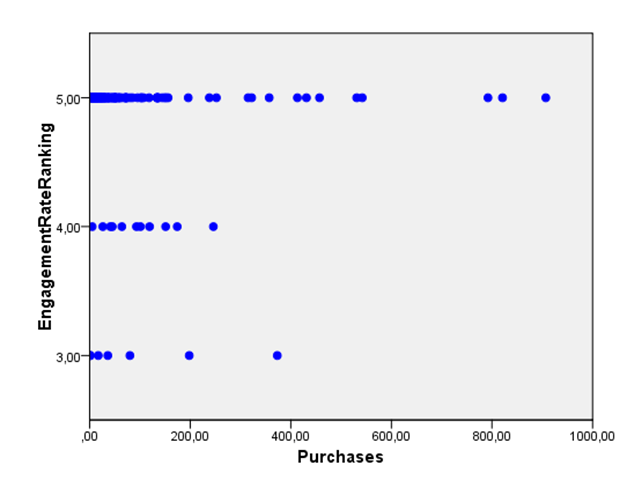
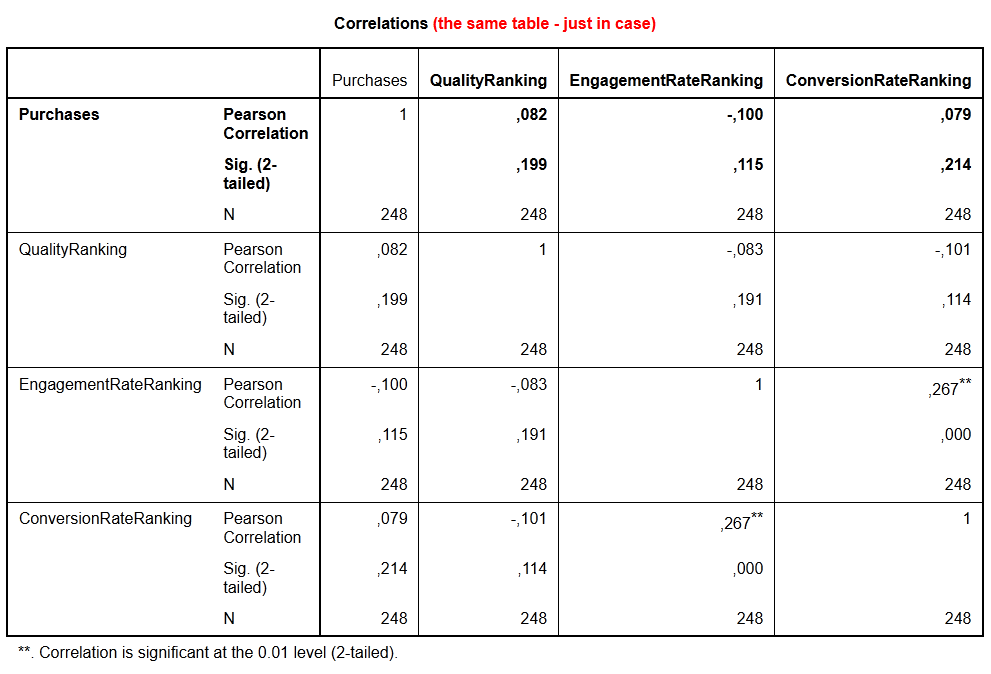
Let’s interpret this set of data:
- There’s a small relationship (Pearson Correlation is less than 0.100) between Purchases and all relevance metrics.
- There’s a positive correlation between Purchases and both Conversion Rate Ranking and Quality Ranking metrics (increasing the Conversion Rate Ranking and Quality Ranking metrics will lead to increased purchases).
- But there’s a negative correlation between Purchases and Engagement Rate Ranking (increasing Engagement Rate Ranking will lead to decreased purchases).
- Correlation is not statistically significant as Sig. (2-tailed) is more than .05 for all relevance metrics (0.199; 0.115; 0.214).
During the analysis of this ad account, there were many ads with an expected above average conversion rate. At the same time, there were no purchases from these ads.
This may influence the results of the correlation test and as a result, the relationship is small between Purchases and Conversion Rate Ranking.
And finally, Case #3 – E-commerce (apparel)
We have 150 ads with ad relevance diagnostic metrics. All of these ads generated 577 purchases in total.
This is what the results looked like:
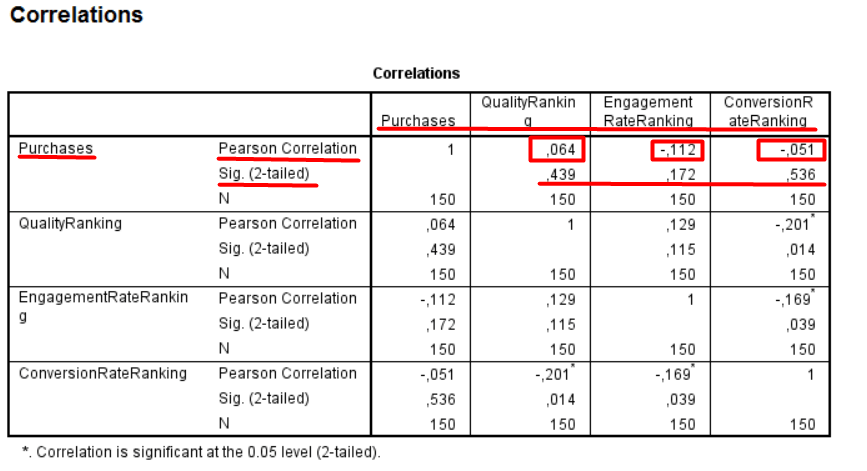
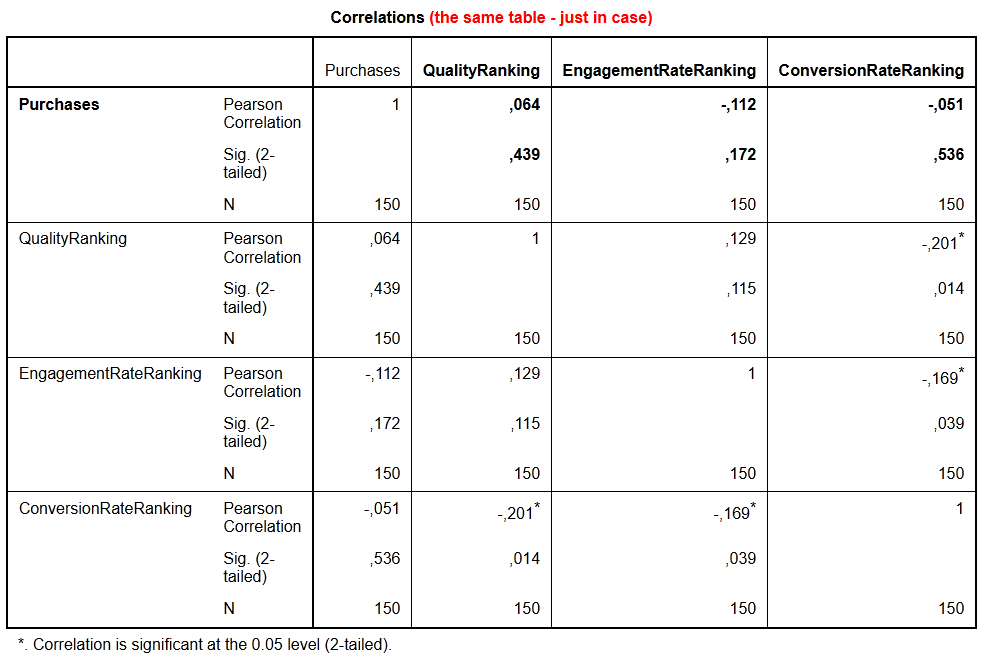
Interpreting this data:
- There’s a weak relationship between Purchases and both Quality Ranking and Conversion Rate Ranking metrics. Plus, a mild strength of Pearson Correlation between Purchases and Engagement Rate Ranking.
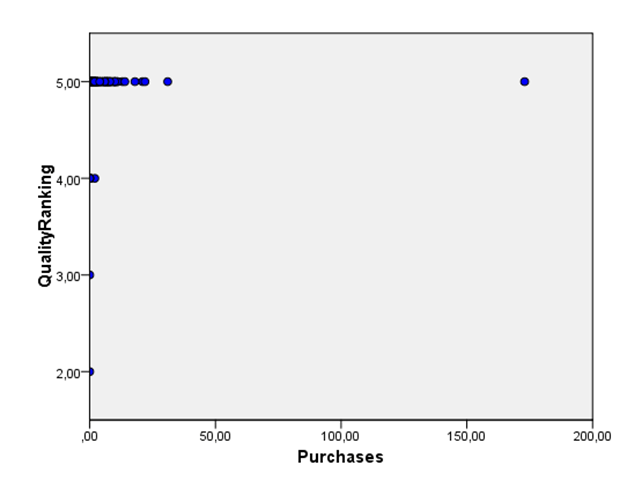
- There’s a positive correlation between Purchases and Quality Ranking metrics (increasing Quality Ranking metric will lead to increased purchases).
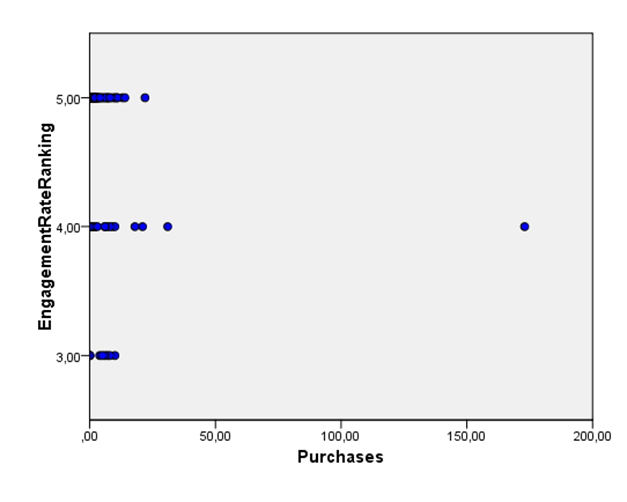
- But there is a negative correlation between Purchases and both Engagement Rate Ranking and Conversion Rate Ranking metrics (increasing these two rankings will lead to decreased purchases).
- Correlation is not statistically significant as Sig. (2-tailed) is more than .05 for all relevance metrics (0.439; 0.172; 0.536).
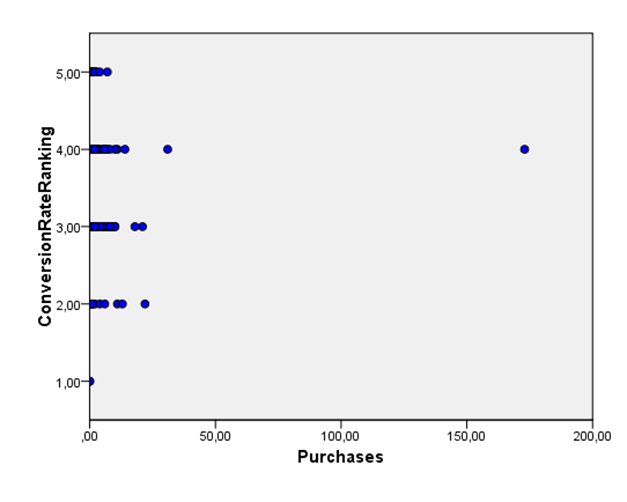
The reason for the negative correlation between Purchases and the Conversion Rate Ranking metric may be because of:
Using all ads with relevance diagnostic metrics despite the stage of the funnel.
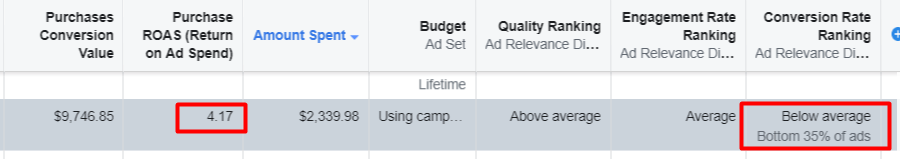
We also often see remarketing campaigns with low ad relevance diagnostics and metrics, but a high ROAS.
Here’s an example of the ad from the remarketing campaign:
Our conclusions:
After conducting the correlation test, we discovered there’s a positive correlation with a medium relationship between two variables in only one case (the case with a lead generation campaign, and where Leads and Conversion Rate Ranking have a positive correlation).
This means that when the Conversion Rate Ranking increases, the number of leads also increases. In other cases, we have a small or weak relationship between variables.
And then in some cases, we even have a negative correlation, which means that increasing one variable will lead to decreasing another variable.
So this doesn’t quite fit the strategy of increasing ad relevance diagnostic metrics—to make the ad more relevant while increasing ad performance.
But at the same time, there is an explanation for these results.
Going back to the questions before the test, here are our final thoughts:
“Facebook says that high relevance is correlated with high performance, but is it true?”
Based on the results, we can say yes, it is correlated. But it doesn’t matter if it’s a positive or negative correlation. We should also be taking into account the strength of this correlation and if it’s statistically significant.
“Is it always the main reason for getting high relevance ads? Or can we abandon those metrics when optimizing and scaling Facebook ads?”
We’ll use the response in Facebook’s help center to answer this one:
“If an ad is already meeting your advertising objectives, reviewing ad relevance diagnostics may not be necessary. Sometimes high-performing ads have below-average ad relevance diagnostics rankings and that’s OK. Optimize for your advertising objectives, not for quality ranking, engagement rate ranking or conversion rate ranking.”
Of course, our correlation test shows how there are positive and negative correlations between some variables. But we wouldn’t use the diagnostic metrics on a daily basis to evaluate an ad’s performance.
There are more important metrics to look at instead. For example, the main metrics our team at AdTribe would consider are: CPA, ROAS, ATC, initiate checkout, secondary metrics or CPC, cost per landing page view, and CTR.
The advantage for these metrics is that they are not estimated (compared to ad relevance diagnostic metrics, which are estimated).
So by looking at those metrics, you can determine if there is something wrong with your ad, offer, or the post-click experience (landing page/UX of your site).
At the end of the day, ad relevance diagnostics may be used as additional metrics to check based on your ad’s overall performance.
Whew! We know there’s a wealth of information and data in this post.
So how are your ads doing these days?
Are you getting the results you want? Maximizing every dollar you invest?
Let’s be honest, if you aren’t, it’s time to rein in the professionals. We know how to sift through and navigate around this world of data, metrics, and analytics.
So if you’re ready to take your Facebook ads to even greater heights (and pronto!) we are too.
We have been recognized as one of the top 30 Facebook Marketing Companies, which means that we do something right.
Connect with our AdTribe team today and let’s fix those pesky ad issues and skyrocket the quality of your ads.