
24 March, 2023
From Struggling to Success: How Our Strategies Took Digital Marketer Evelyn to $100k Monthly Recurring Revenue
How Cohort Analysis Can Help eCommerce Brand To Scale Profitably
Scaling an eCommerce business is hard, and scaling it at profit is even harder. The more customers a brand acquires, the more expensive its customer acquisition costs become.
So, how to win this fight?
You may think that to grow your brand you should focus on maximizing customer acquisition, but the truth is that existing customers are where the money is.
According to BIAKelsey, half of the annual revenue of small businesses comes from repeat customers rather than new customers. Moreover, a repeat customer spends 67% more than a new customer.
As such, if you want to scale, it’s of uttermost importance to invest in understanding the behaviors of existing customers and adjusting your marketing strategy and messages to encourage further spending.
How can you do that?
With a data-oriented approach, which comes down to cohort analysis.
What is Cohort Analysis?
The Dictionary definition of a cohort is “a group of persons sharing a particular statistical or demographic characteristic”
In education, a cohort is used to refer to a group of students, such as one consisting of students who started in the same year, or one of the multiple smaller groups that a class has been divided into.
In eCommerce, a cohort could be a group of people who bought their first product on Black Friday campaign; people who bought a specific product; people who bought at least three times from a brand; etc.
Cohort analysis would refer to the process of analyzing those groups of people and what they have in common – their buying behaviors, tendencies, and activities over a specific time period.
A cohort analysis, unlike segmentation, groups customers based on historical data with the aim of analyzing their patterns and behaviors.
For example, let’s say you launched a marketing campaign on Facebook which resulted in 100 new customers acquired and another marketing campaign on TikTok which also resulted in 100 new customers.
Each of those groups is a cohort. You could then analyze the behaviors of each cohort in terms of retention. You may find that the cohort from your TikTok campaign tended to make more future purchases than the one from the Facebook campaign.
This finding would tell you that your budget is better allocated to Instagram rather than Facebook (as it leads to higher retention and in turn long-term profit).
Why Does Every eCommerce Business Need Cohort Analysis?
Cohort analysis allows you to figure out small details that can offer greater insight into what is working and what isn’t in your marketing strategy, what patterns exist in your campaigns, and which course of action would lead to enhanced results.
It can provide answers to numerous kinds of questions:
- Which campaigns lead to better retention?
- What offers on Black Friday would lead to the highest LTV?
- What is the best time to implement a re-marketing campaign?
In short, cohort analysis allows you to optimize campaigns based on real data, as opposed to false conclusions.
In the example we mentioned previously, you may have thought that your TikTok and Facebook campaigns perform equally well. The truth was that the TikTok campaign was much more profitable.
Now that we’ve covered the importance of cohort analysis, let’s discuss its specific benefits in detail.
1. It can help you reduce customer churn
Cohort analysis allows you to gain valuable insights into retention-related behaviors such as time of second purchase, time of loss (i.e. when do customers tend to stop engaging with your brand), and amount of orders over time-based on how customers were acquired.
This analysis allows you to figure out what is working well and what is causing problems to your average customer lifetime value (CLV).
Let’s say you have an email strategy in place that doesn’t seem to be performing well in maintaining subscribers (in turn affecting your customer retention).
With cohort analysis, you may find that subscribers tend to drop out mostly after the fourth email in your sequence. This would lead to the hypothesis that there’s something about that email that is leading people to unsubscribe.
2. It allows you to make predictions and plan accordingly
Cohort analysis allows you to predict future behavior based on historical data. These predictions can come in handy in multiple ways.
For inventory purposes, assessing how many orders tend to take place in specific seasons and holidays such as Christmas allows you to prepare inventory ahead of time, and lower it when demand is predicted to be low.
In terms of revenue, the ability to forecast profits for specific time periods can help you better understand how much you can invest in marketing campaigns while remaining profitable.
3. It helps you optimize marketing strategies
Attribution capabilities that result from cohort analysis can help you identify which marketing channels are leading to the best results, both on the short term and long term.
The ability to accurately understand the results of specific channels allows you to optimize under-performing campaigns on a micro level (for example, by changing the copy and creative of specific ads) and on a macro level (perhaps by changing an entire marketing strategy if you find that a channel like Instagram is performing very poorly).
Moreover, you can make optimizations in terms of spending. You may find that some investments are resulting in a very low customer retention rate while others are performing very well. In this case, you may want to consider allocating more of your budget to what’s working and less to what isn’t in order to increase your ROI.
4. It allows you to optimise offers and promotions
The ability to understand which of your products are selling the most allows you to invest more in specific offers to further maximize sales.
Additionally, you can use insights to understand which of your products are not selling as often and optimizer accordingly, perhaps by creating promotions for those products.
Of course, inventory planning can also be made more accurate with this analysis, because you can stock up on products that sell a lot and under-stock on the ones that don’t.
Important metrics for cohort analysis
Below are the most important metrics to watch out for while doing a cohort analysis:
Repeat Rate / % to Second Order – this metric measures the rate of customers that make more than one purchase compared to one-time buyers. It’s a particularly useful metric for gaining insight into your retention rate.
Orders per Customer – as the name suggests, this metric shows the average number of orders for customers in a specific cohort (e.g. customers acquired in January 2022 have made on average 3 orders each).
Time Between Orders – this is a great way to understand how long it usually takes for customers in a specific cohort to make a new order. This allows you to strategically plan promotional campaigns around the time when customers are more likely to make a purchase.
Customer Lifetime Value (CLV) – CLV allows you to know the monetary value (profit) your customers are generating on the long-term.
Average Order Value (AOV) – this metric shows you how much each customer in a cohort spends on average, allowing you to target buyers that tend to spend more in order to maximize ROI.
How to do cohort analysis? A case study
Ok, that all sounds nice and neat but how do you actually do cohort analysis, and what tools to use?
Don’t worry – it’s not as hard as it sounds.
We will walk you through the analysis process we do for our clients at AdTribe using real data from an eCommerce brand that sells cookies.
The problem
Even though the conversion rate of this business was pretty high (almost 5%), the average order value was below $25. With the current cost of advertising on social media platforms, it’s a huge challenge to get at least breakeven on the first purchase.
The tool
At AdTribe we use Lifetimely, and we highly suggest that you use it too if your business is on Shopify. It allows you to do lifetime value projections and customer analysis on a user-friendly platform.
The process
Every analysis starts with asking questions. Here is the type of questions you can ask when you perform a cohort analysis for your brand:
What is the overall customer LTV over the 60d, 90d, 120d periods?
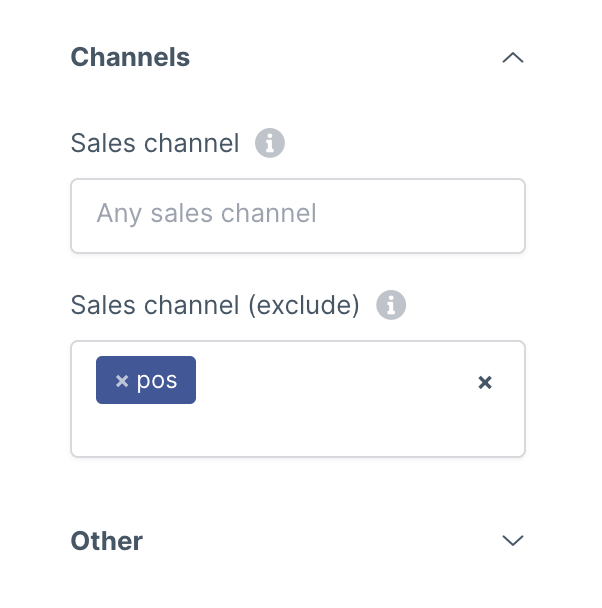
An interesting thing about this business is that almost half of its sales are done offline in one of its stores in New Jersey. So, for the sake of this analysis, we will exclude all sales done via the point of sale channel (pos). That can be easily done via the filters section.
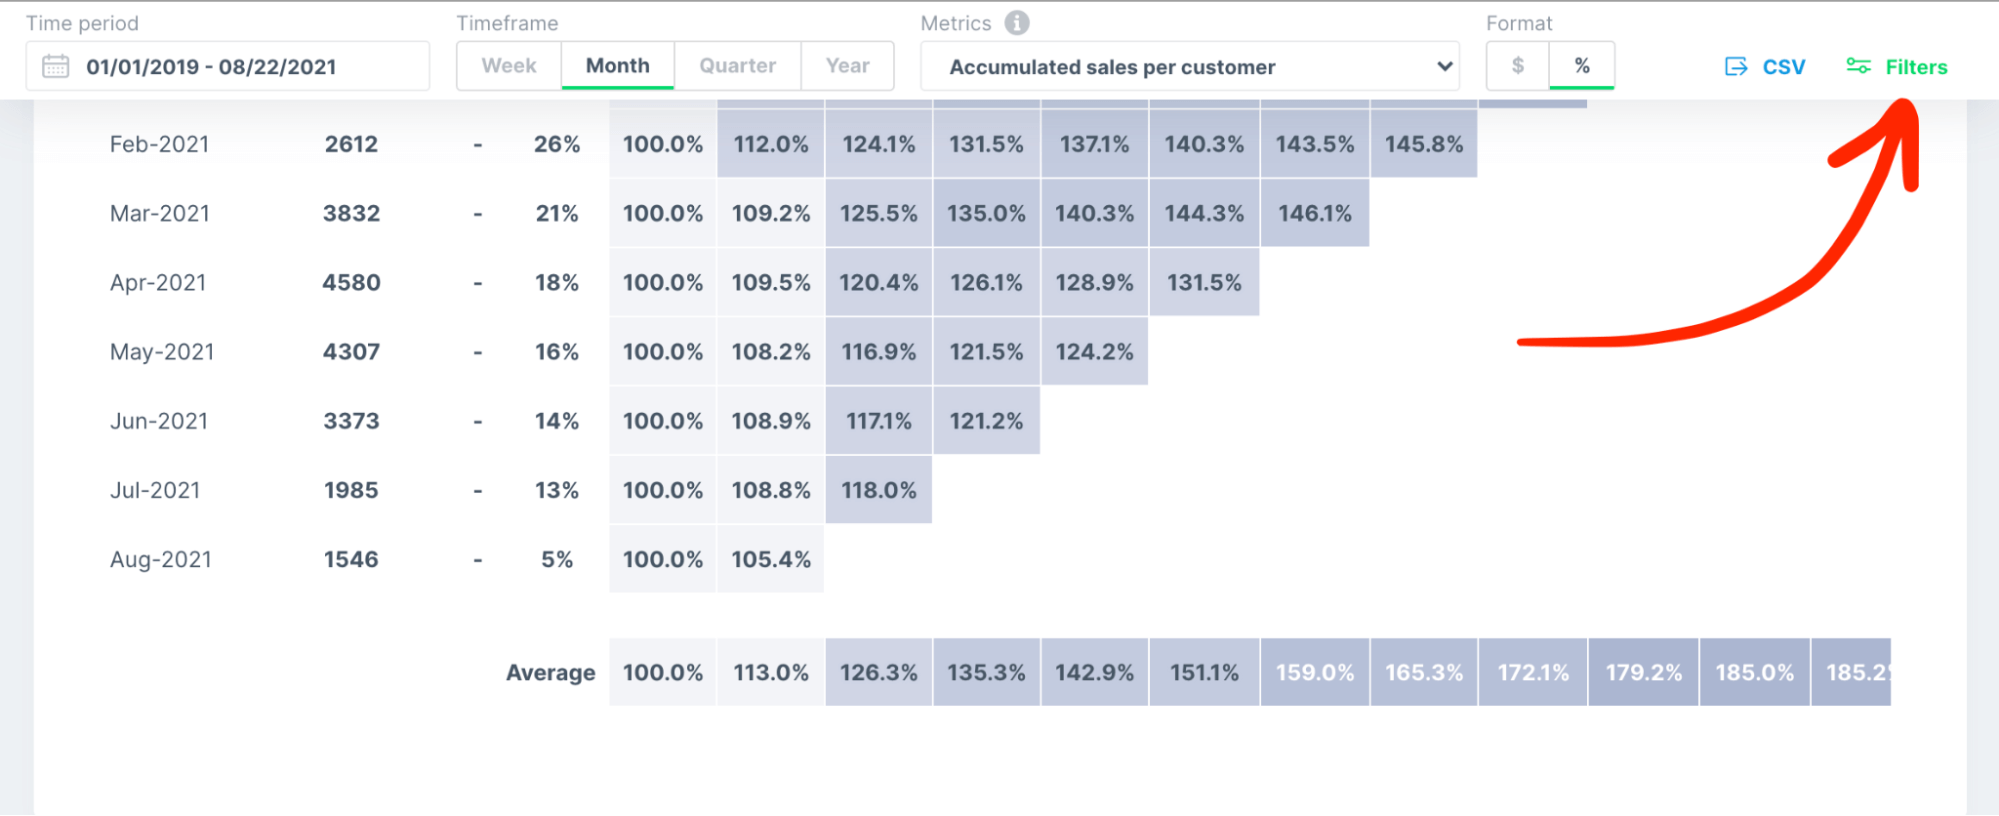
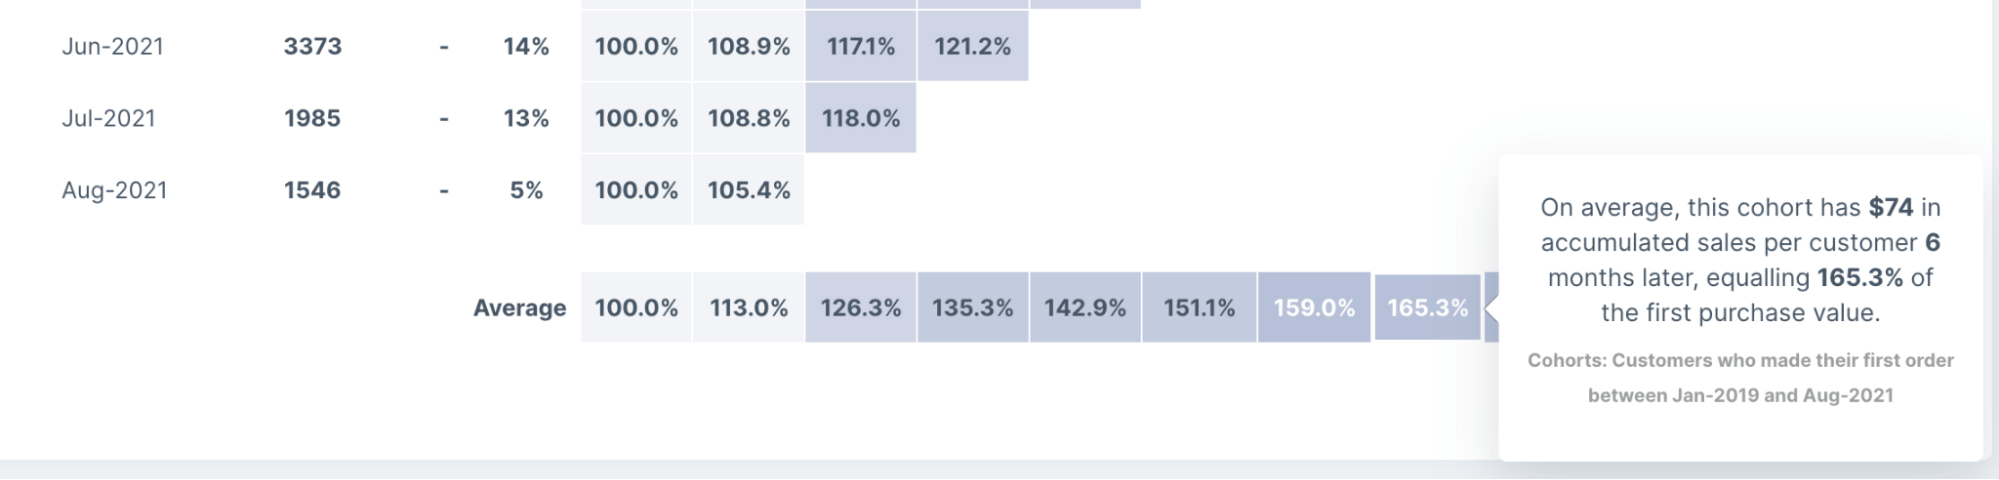
Here is what we get:
90d – on average, customers accumulated sales equaling 142.9% of the first purchase value
120d – on average, customers accumulated sales equaling 165.3% of the first purchase value
This data basically tells you that you can pay more to acquire new customers and still be profitable within 60d, 90d, 120d periods (depends on how aggressive with acquisition you want to be).
What cohort based on time of conversion brings the highest returns?
We got the average LTV numbers on how AOV increases over time. We can do a step forward though to understand what cohort based on the month people do their first purchase brings the highest returns.
To do so, just sort out data based on the highest value in a spreadsheet that Lifetimely provided you with. For the sake of this analysis let’s focus on 90 days period, as not so many businesses can wait for 120 days to get their money back.
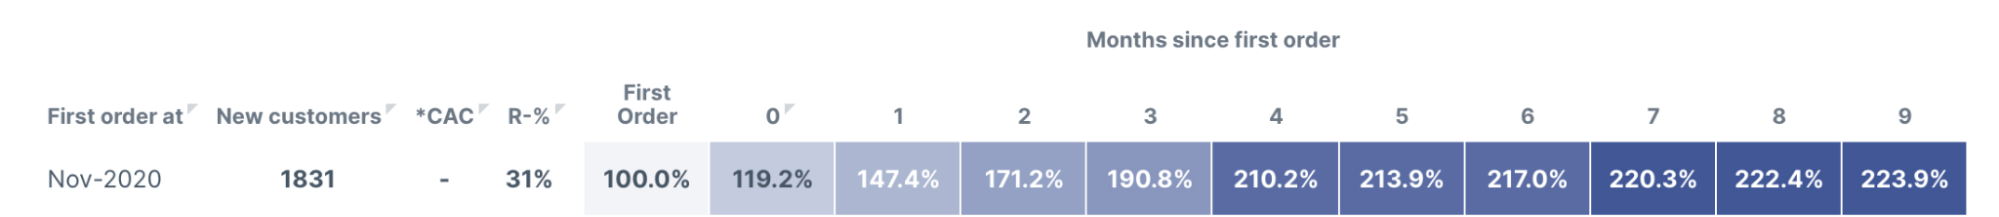
Unsurprisingly, the data shows that the most profitable month for this business is November (historically this is the best month to put more dollars behind customer acquisition).
You can go even deeper to understand what ROAS business was getting during that period, and based on data be much more aggressive with ad spend, as you know that in December people will come back again and buy more.
What product brings the highest LTV to your brand?
The first order from a store is often a test so customers can judge the quality and service you provide.
If they get hooked on the first thing they buy from you and come back again and again, you got a winner – a great product that inspires loyalty. But how do you find a great product that gets people hooked?
Lifetimely has a cool feature called Product Journey. Here’s how it looks like:
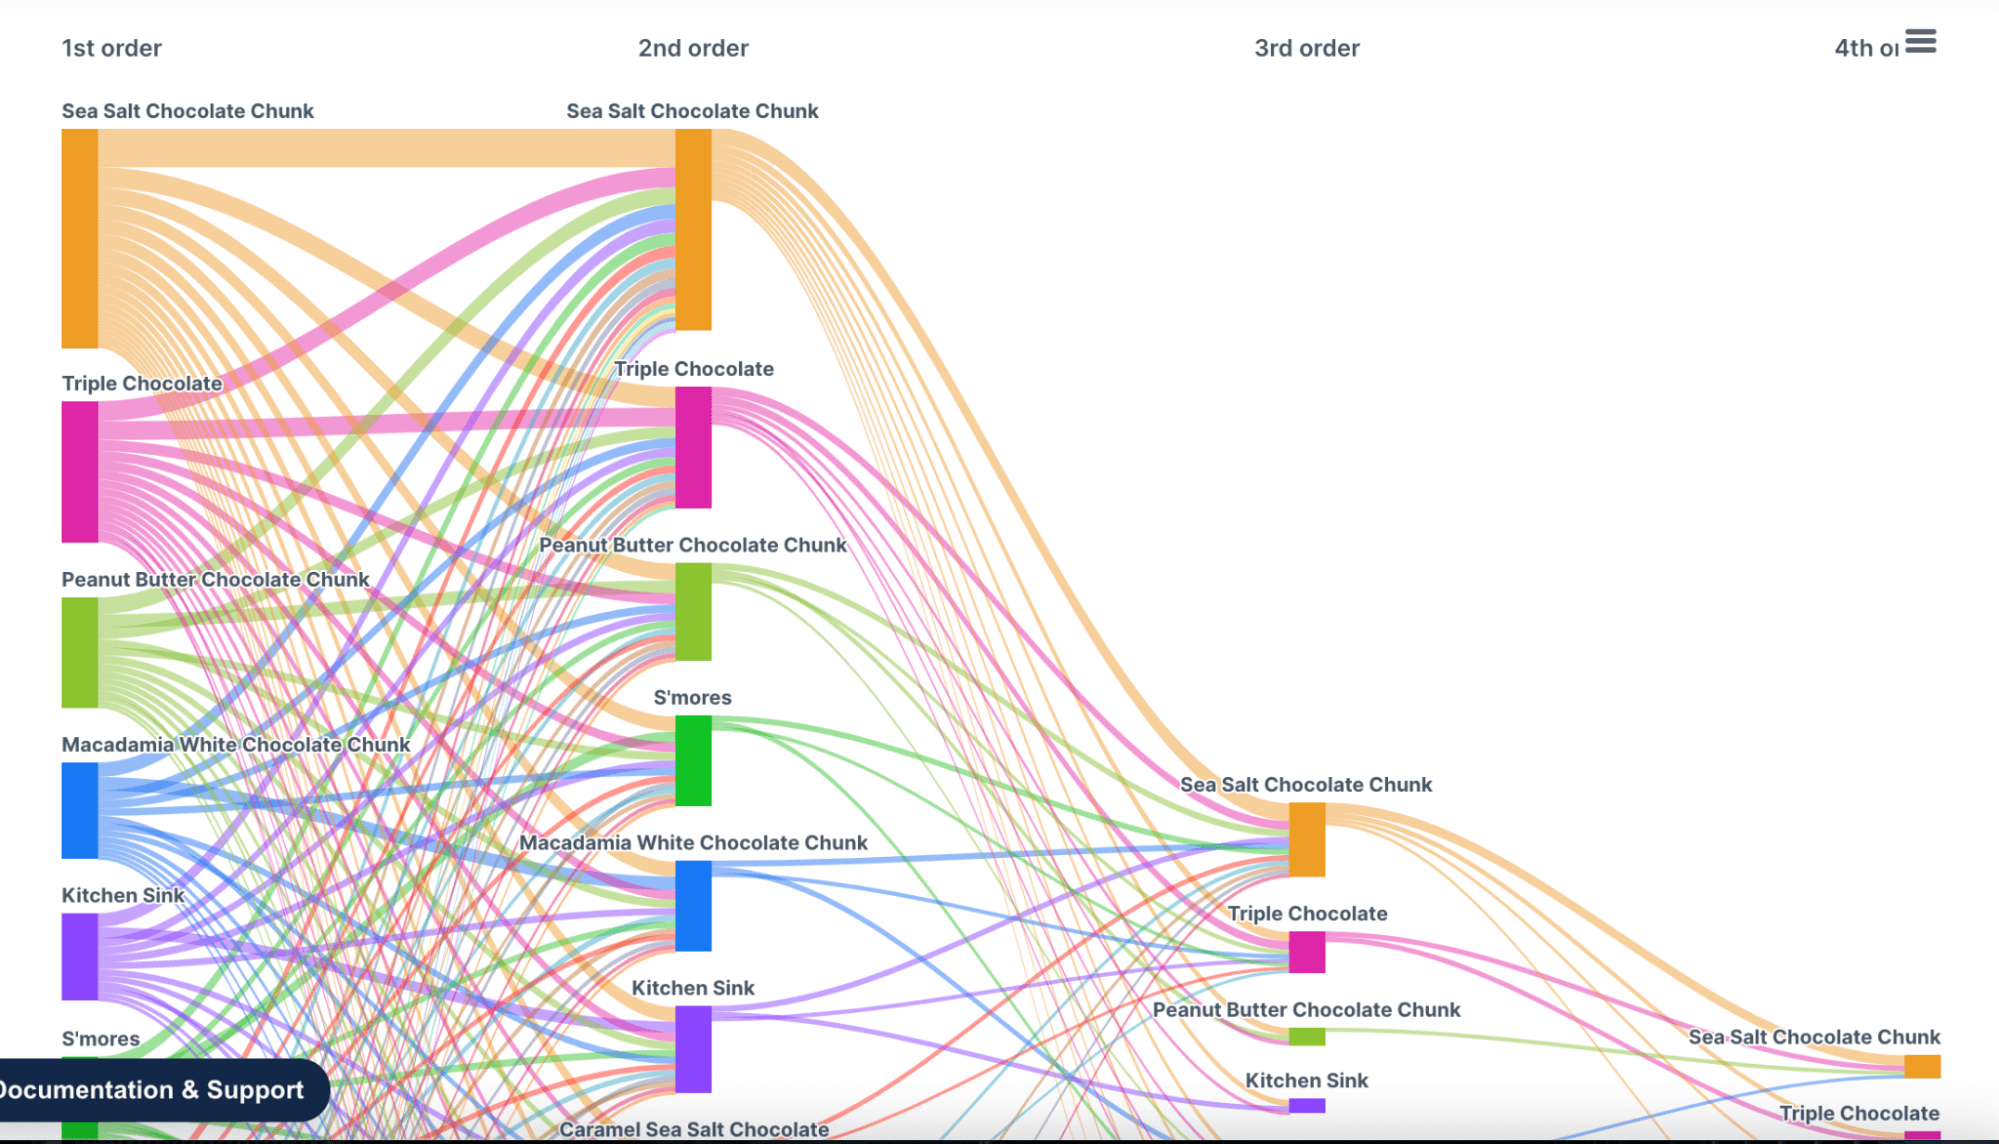
You don’t need to be a data scientist to understand that Sea Salt Chocolate Chunk and Triple Chocolate cookies lead to the highest retention.
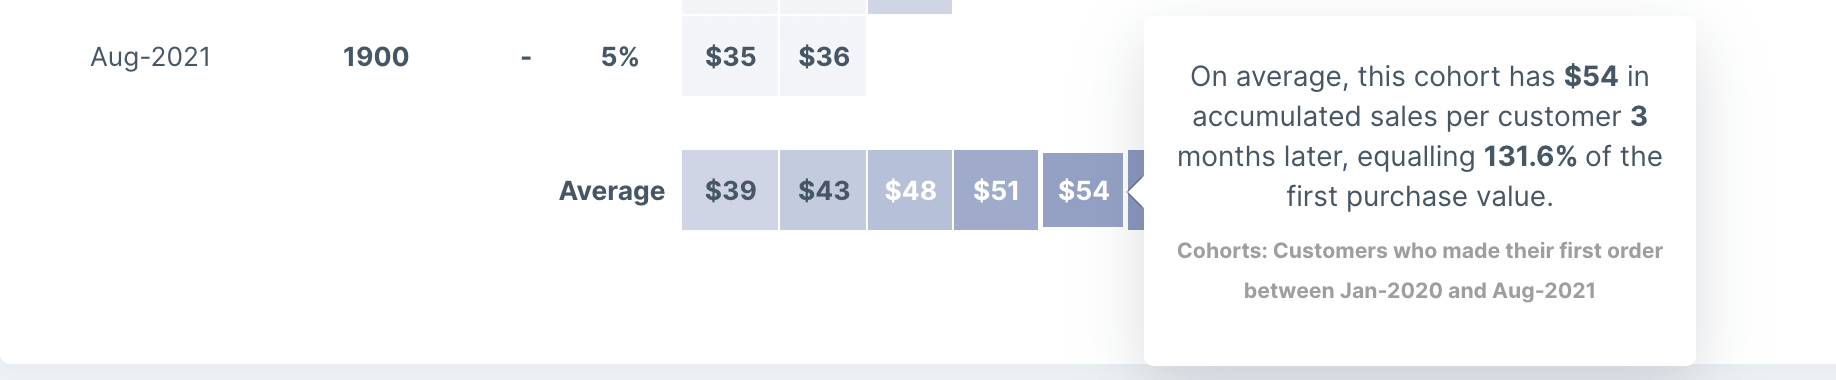
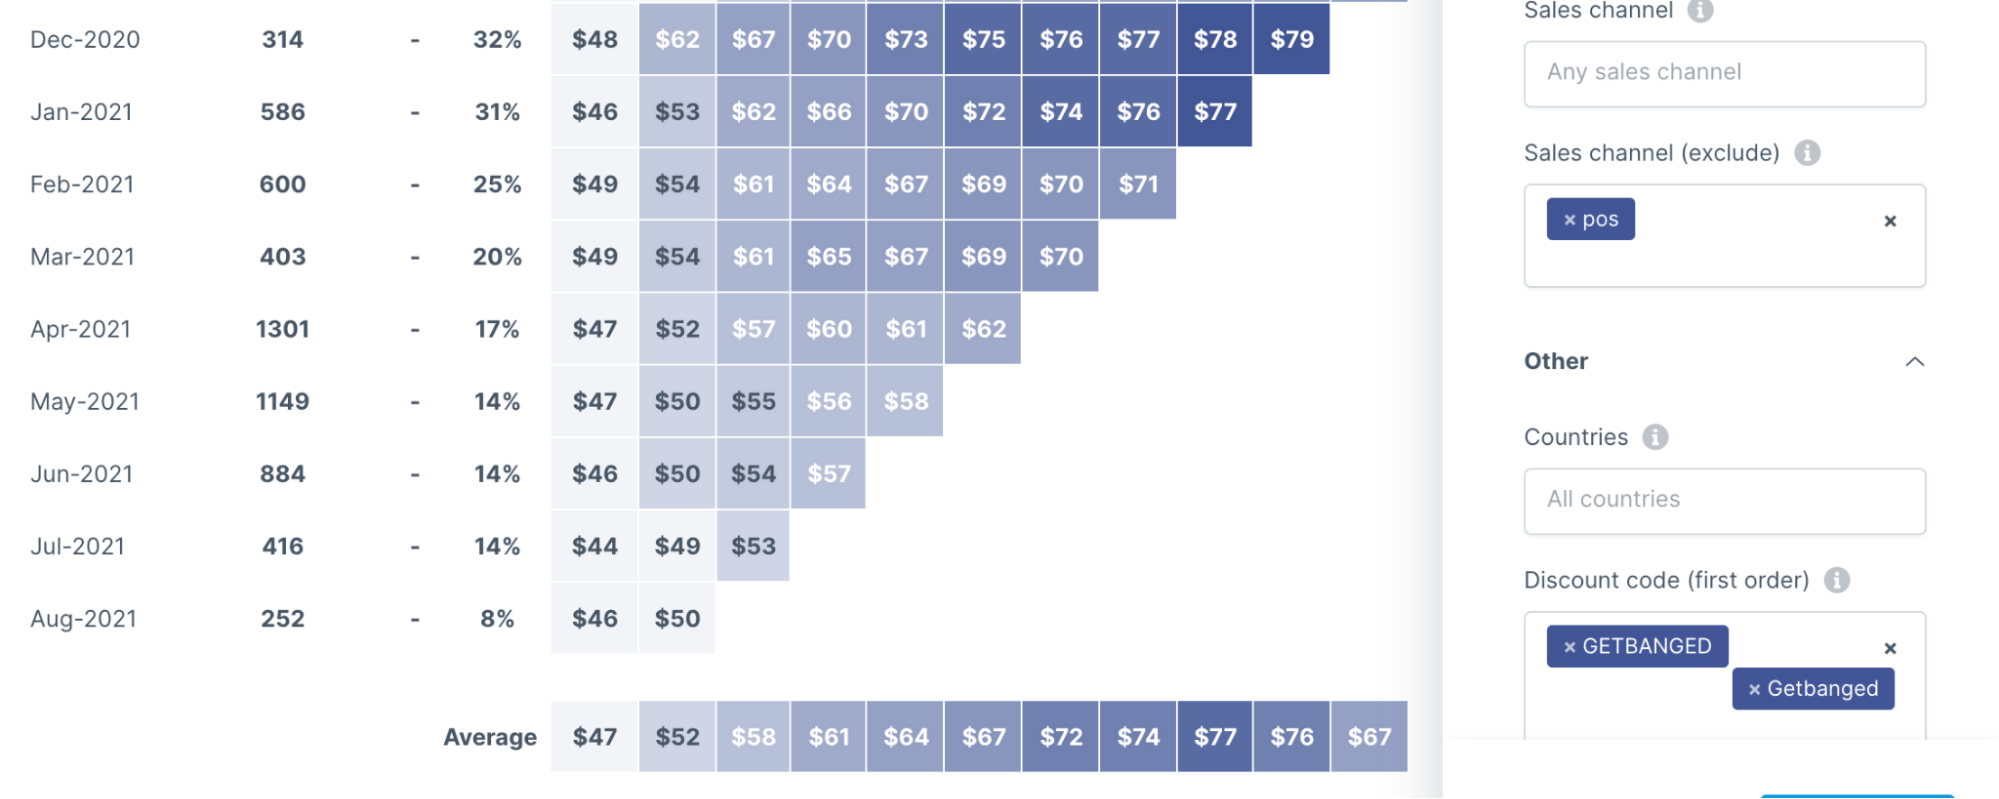
Let’s compare how much on average Sea Salt cohort brings in sales against Triple Chocolate.
Within the first 3 months, Sea Salt brought $54 in value per customer:
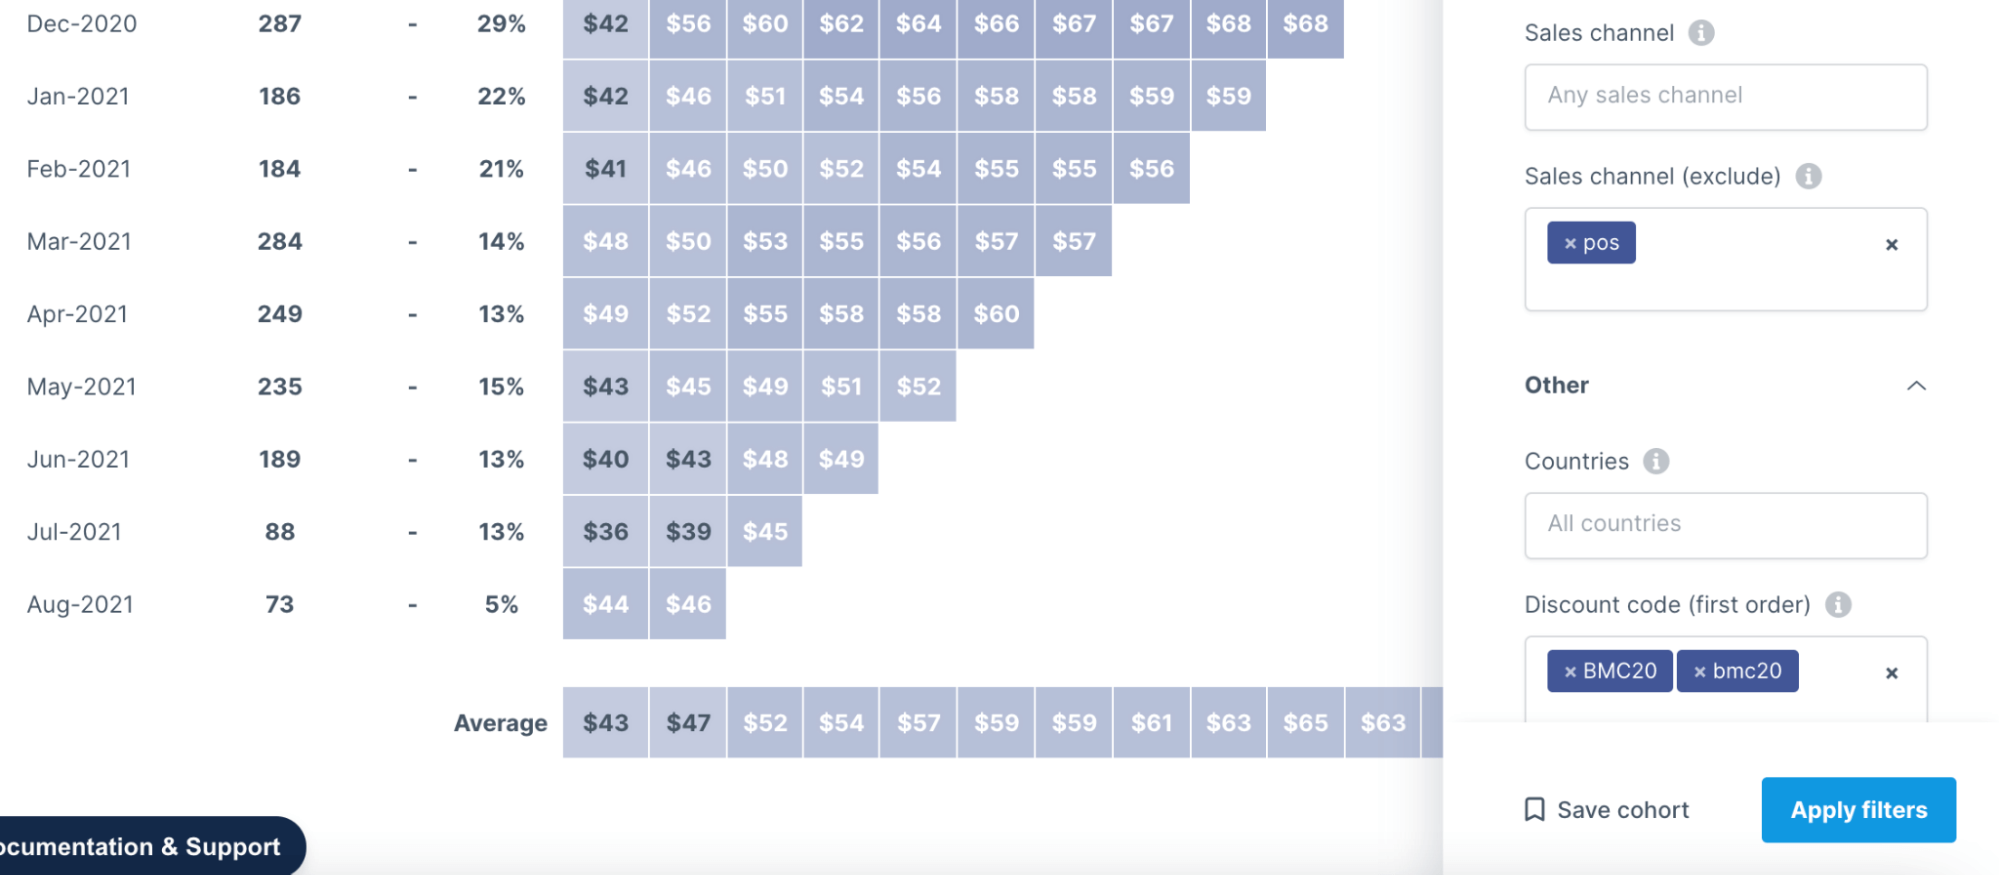
Triple Chocolate brought $59 in value per customer:
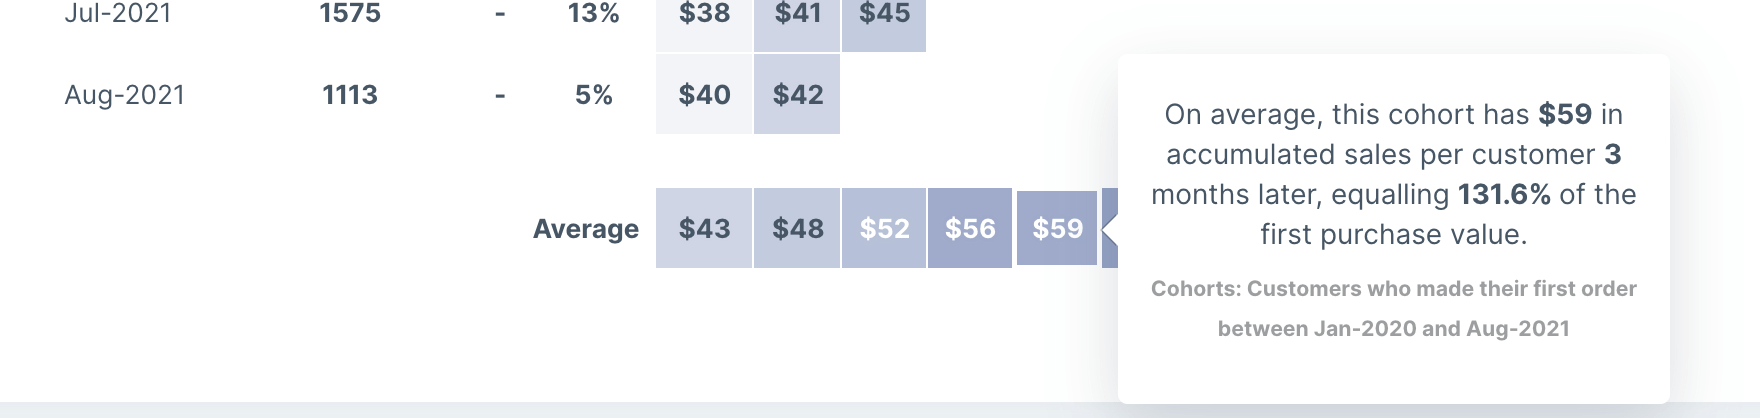
When you know the products that bring your business the highest returns, the logical thing to do is to put more money behind them.
Instead of just driving traffic to product pages or category pages, you build the campaigns around these products. You can build separate landing pages, amplify quizzes or other types of funnels, build separate campaigns structure, etc.
How does using discount codes impact the LTV?
Using discounts with your paid marketing efforts could bring higher conversions but you might end up with an unwanted side effect – customers who are only willing to buy your product with incentives.
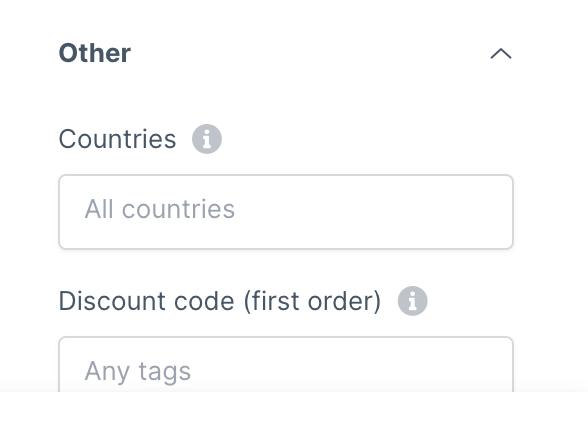
To find out how much cohorts who used discounts worth to your business go to Filters section and scroll down to the bottom to get to Discount code section.
Something interesting might pop up. For example, customers who use 10% on their first purchase actually worth more to you than those who didn’t use a discount. Moreover, customers who use the 10% discount code tend to spend more on their first order as well.
Ok, what about 20% off?
As you can see, numbers are lower here, so you might consider sticking to 10% only.
When and what to sell to first-time buyers?
Most of the up-sell or cross-sell marketing strategies are based on assumptions.
For example, you might start retargeting your first-time buyers with a new offer after two weeks when the first purchase was made, as you think that’s enough for the average customer to get the product shipped and experience it.
But is it? 🤔
Or is there a better (data-driven) way to schedule retargeting campaigns?
Here is where the time between orders metric comes in handy. It helps you measure the real frequency of purchases.
When you know people usually buy every 23 days, you can make them buy more often by sending offers every 21 days, for example.
They’re about to be ready to buy again anyway so your offer is well-timed and welcome. At the same time, it speeds up the buying cycle by 2 days, which means more orders every month!
Lifetimely has a useful feature called Time Between Orders:
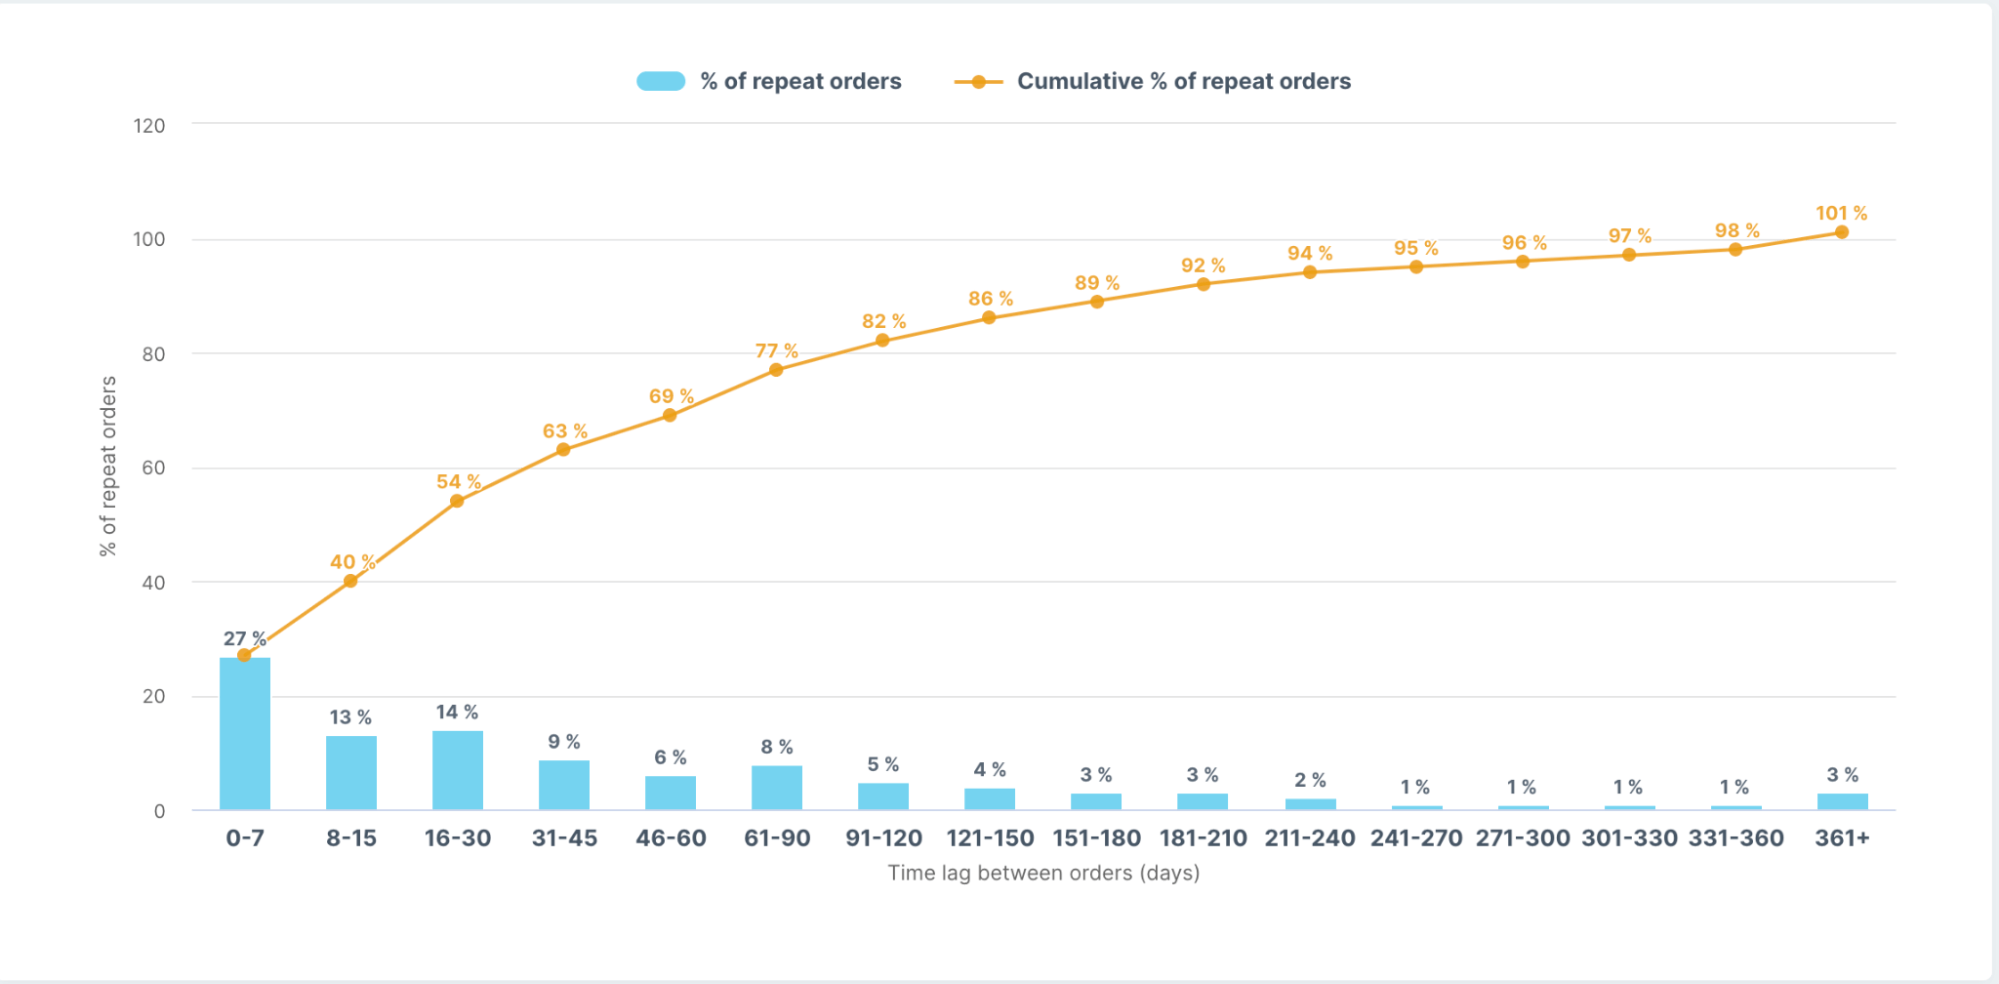
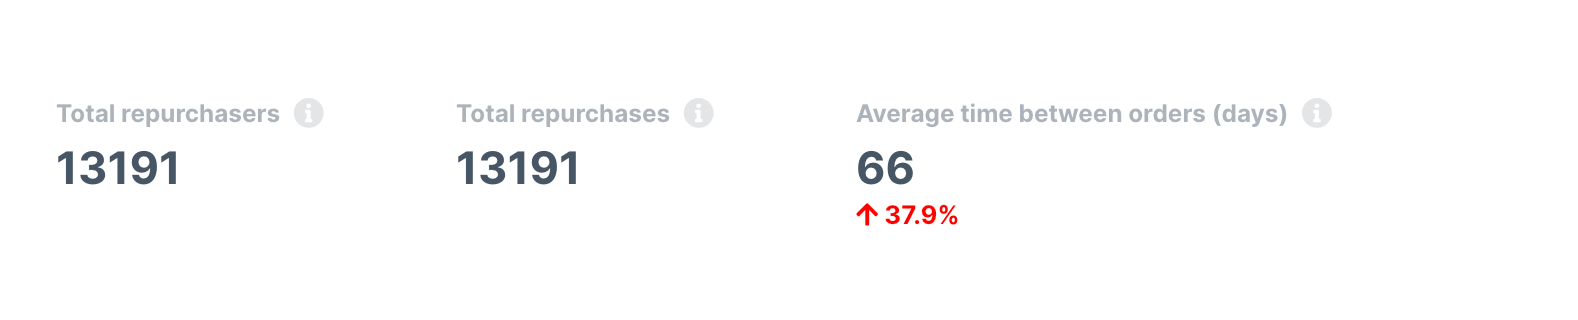
It gives you an idea of when customers typically come back again between 1st and 2nd order. For example, 27% of first-time buyers come back again within a week. Also, the feature gives you the average time between orders:
This data still doesn’t provide information on when is the best time to start retargeting first-time buyers, and more importantly with what.
To uncover these insights, Lifetimely allows you to download data in CSV format.
To find out what products customers buy more frequently and when they do so, just sort out the spreadsheet by Average Time Between Orders column and filter out only 1st and 2nd orders. Here is what you should get:
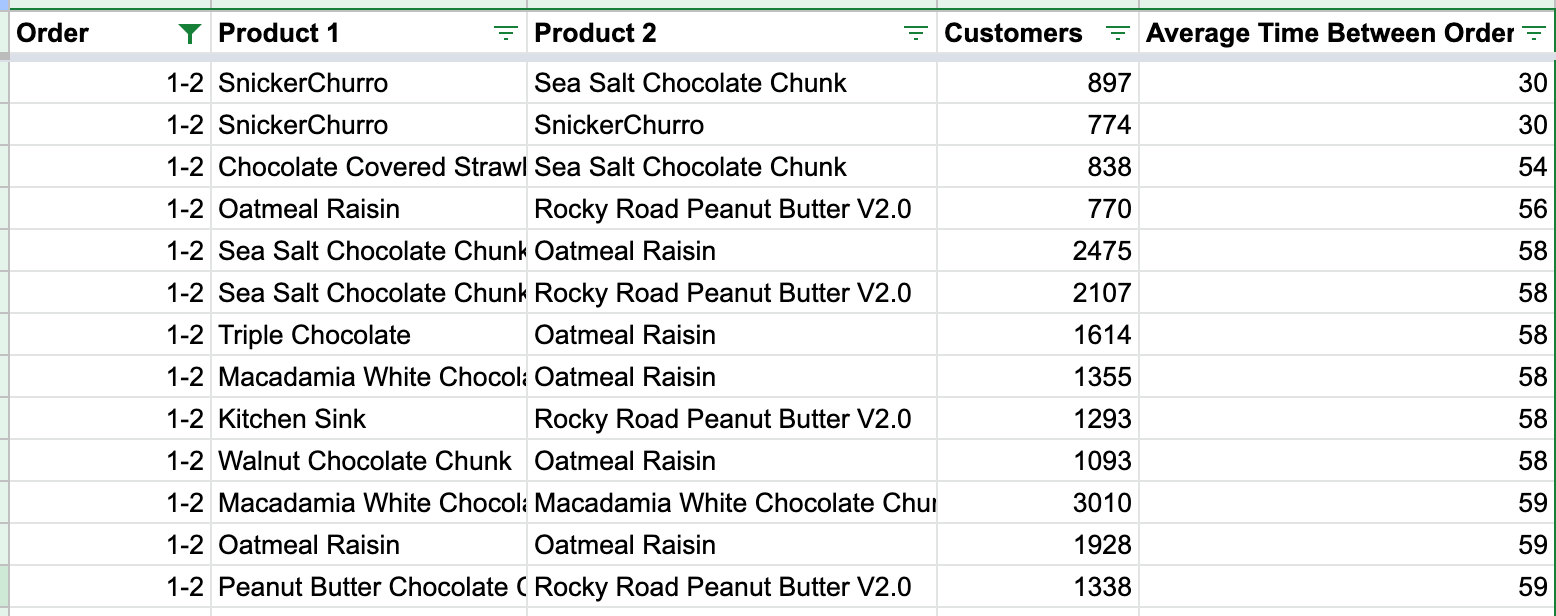
Based on the data above you can see that the lowest avg time between orders has product combination SnickerChurro → Sea Salt Chocolate Chunk. Hence, you can test a separate paid media campaign alongside an email campaign on this combination in a 28 days window.
Conclusion
Understanding and analyzing data properly can give you that unique advantage over others in your field. Methods like cohort analysis not only help you understand your current customers but also provide you with a predictive model for the future.
You can tweak your strategies according to the analysis and get amazing results out of the process (read bringing more money to our pocket 🤑)
If you’re in need of help, feel free to contact us. Our team has generated great results for previous clients – both through cohort analysis and numerous other marketing efforts – and we’d love to help you as well!
Related articles


24 June, 2022
How to Increase eCommerce Conversion Rates